Perf review: the 5 slowest spots
Ask for faster code and you probably get a cache: timings from a profile, one matching fix each, its lines and expected speedup.
849 saves on X, as of
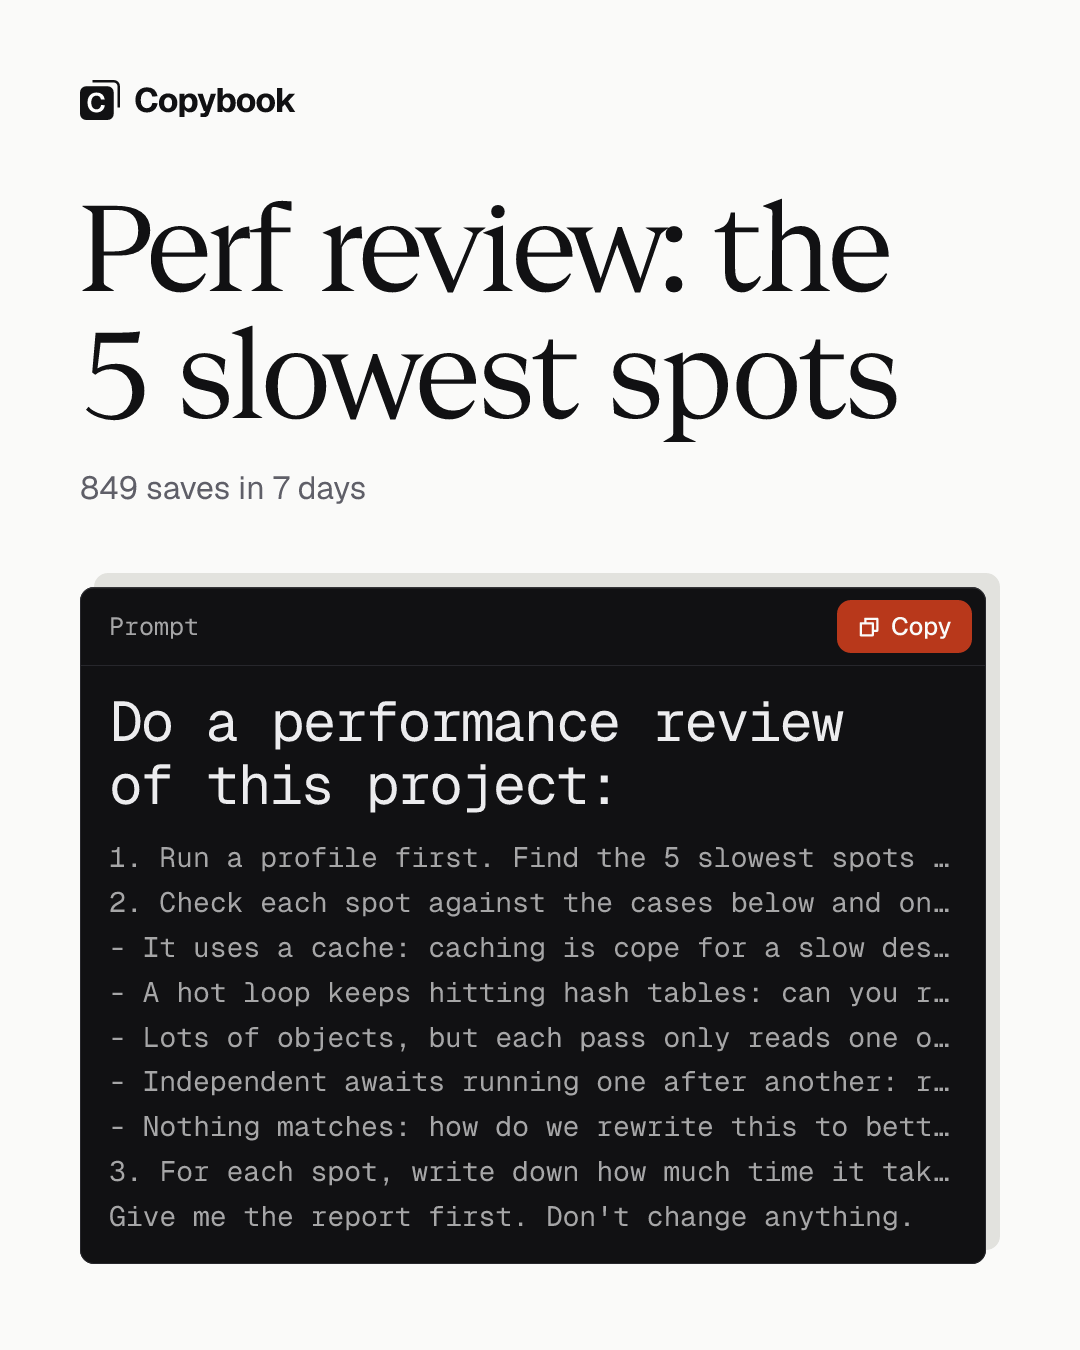
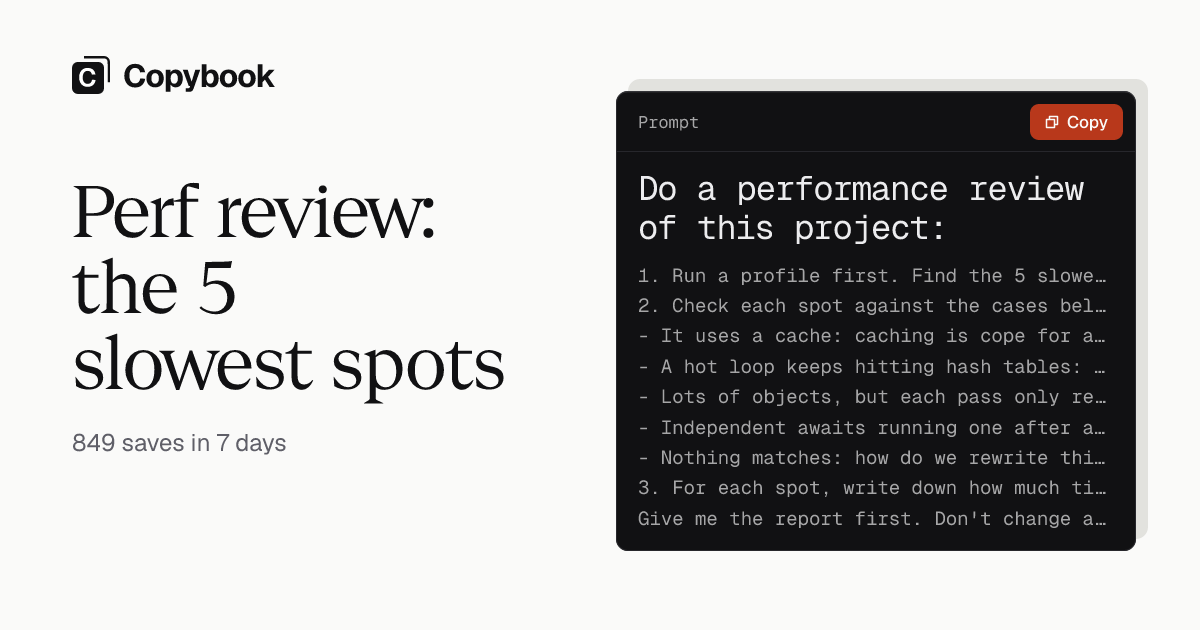
Do a performance review of this project:
1. Run a profile first. Find the 5 slowest spots and how much time each one takes.
2. Check each spot against the cases below and only apply the one that matches:
- It uses a cache: caching is cope for a slow design. Don't add more caches. See if it can be redesigned to be fast on its own. List the existing caches and flag which ones are hiding a slow design.
- A hot loop keeps hitting hash tables: can you replace those hash tables with a flat array? Can we make the pointers an index into the array? Can we pack the most commonly used data into upper bits of the index?
- Lots of objects, but each pass only reads one or two fields: should this be a structure of arrays instead of an array of structures (AoS → SoA)?
- Independent awaits running one after another: run them in parallel.
- Nothing matches: how do we rewrite this to better leverage data-oriented design principles?
3. For each spot, write down how much time it takes now, which case it matched, which file and lines to change, and the expected speedup.
Give me the report first. Don't change anything.
Use it
Send it to Claude Code in your project.
You get A report on the 5 slowest spots, each with its fix and expected speedup, and nothing changed.
Tell Claude Code to “make it faster” and it’ll probably add a cache. People who actually do perf work name the exact structure they want instead.
Add Copybook to your agent, then ask it next time. Set it up
Four of the five cases are adapted from a Jarred Sumner post: “some things I often say to claude when doing perf optimization work”.
Share this tip